This blog post is based on EVM Workloads in the Wild which was accepted at AFT'26.
Many chains run on the EVM (Ethereum Virtual Machine), including Monad, Ethereum, and Base. Pricing and positive user experience (UX) rely on one key assumption: that execution conditions are by-and-large stable. This is expressed by assigning each operation a scalar price (in gas) that reflects relative costs. Such a fixed relative price mechanism only works properly when the workload (operation) mix stays constant over time. Ethereum and Base share the same opcode price schedule, which implicitly assumes similar usage patterns. However, Layer-2s like Base have a vastly different set of resources than Ethereum. One resource (like compute) might be greatly favored over another (like persistent state).
The quality of user experience also hinges on stable execution conditions. When a transaction is generated, it is often simulated to verify success and to estimate required gas payment. However, this is done at a point in time that might not reflect the actual execution point of the transaction. Highly state-sensitive transactions might fail to realize their desired outcome when there's been significant state drift between simulating a transaction and subsequent execution. We measured the extent to which stable resource demand and stable pre-state hold on Ethereum and Base.
TL;DR
- We perform measurements on both Ethereum and Base throughout 2025, decomposing opcode-level gas and persistent-state changes (state growth), and tracing storage access patterns.
- Despite sharing the same opcode price schedule with fixed relative prices, the two chains spend gas on different resources. While the exact composition varied throughout 2025, storage reads (29.2%) led on Base; storage writes (34.9%) led on Ethereum.
- Base added 435 GB of persistent state in 2025 against Ethereum's 30 GB, showing a 14.5× gap that gas limit differences alone cannot explain.
- We simulate transactions' execution across (past) historical states, showing for example that in September 2025, simulating up to 20 blocks before inclusion changes the gas estimate for 46.0% of Base transactions, as opposed to 13.9% on Ethereum.
- The data indicates that both assumptions fail in practice: the resource mix varies, and the pre-state drifts. More advanced designs like delayed or parallel execution further increase uncertainty of execution state. Multi-dimensional designs are well-suited to such environments to avoid the failure modes we point to.
Methodological overview
The current pricing methodology in most EVM chains relies on pricing operations that a transaction performs as fixed multiples of a unit of account (gas). This schedule is identical for Ethereum and Base and rarely changes: most such changes are related to mis-priced storage operations. This work empirically indicates that a single-dimensional measure is inherently a poor predictor of and consequently an ineffective constraint on persistent state growth.
We gather a dataset to support our claims: we sample 3,000 blocks per day of 2025 per chain, covering about 42% of Ethereum's blocks (219.8 million transactions) and 7% of Base's blocks (256.5 million transactions). We decomposed each transaction into opcode-level execution gas, intrinsic gas, refunds, and state changes. Finally, we label 62.9% of Ethereum transactions and 75.8% of Base transactions by category: MEV, DeFi, tokens, infrastructure, and transfers.
The workload mix shifts
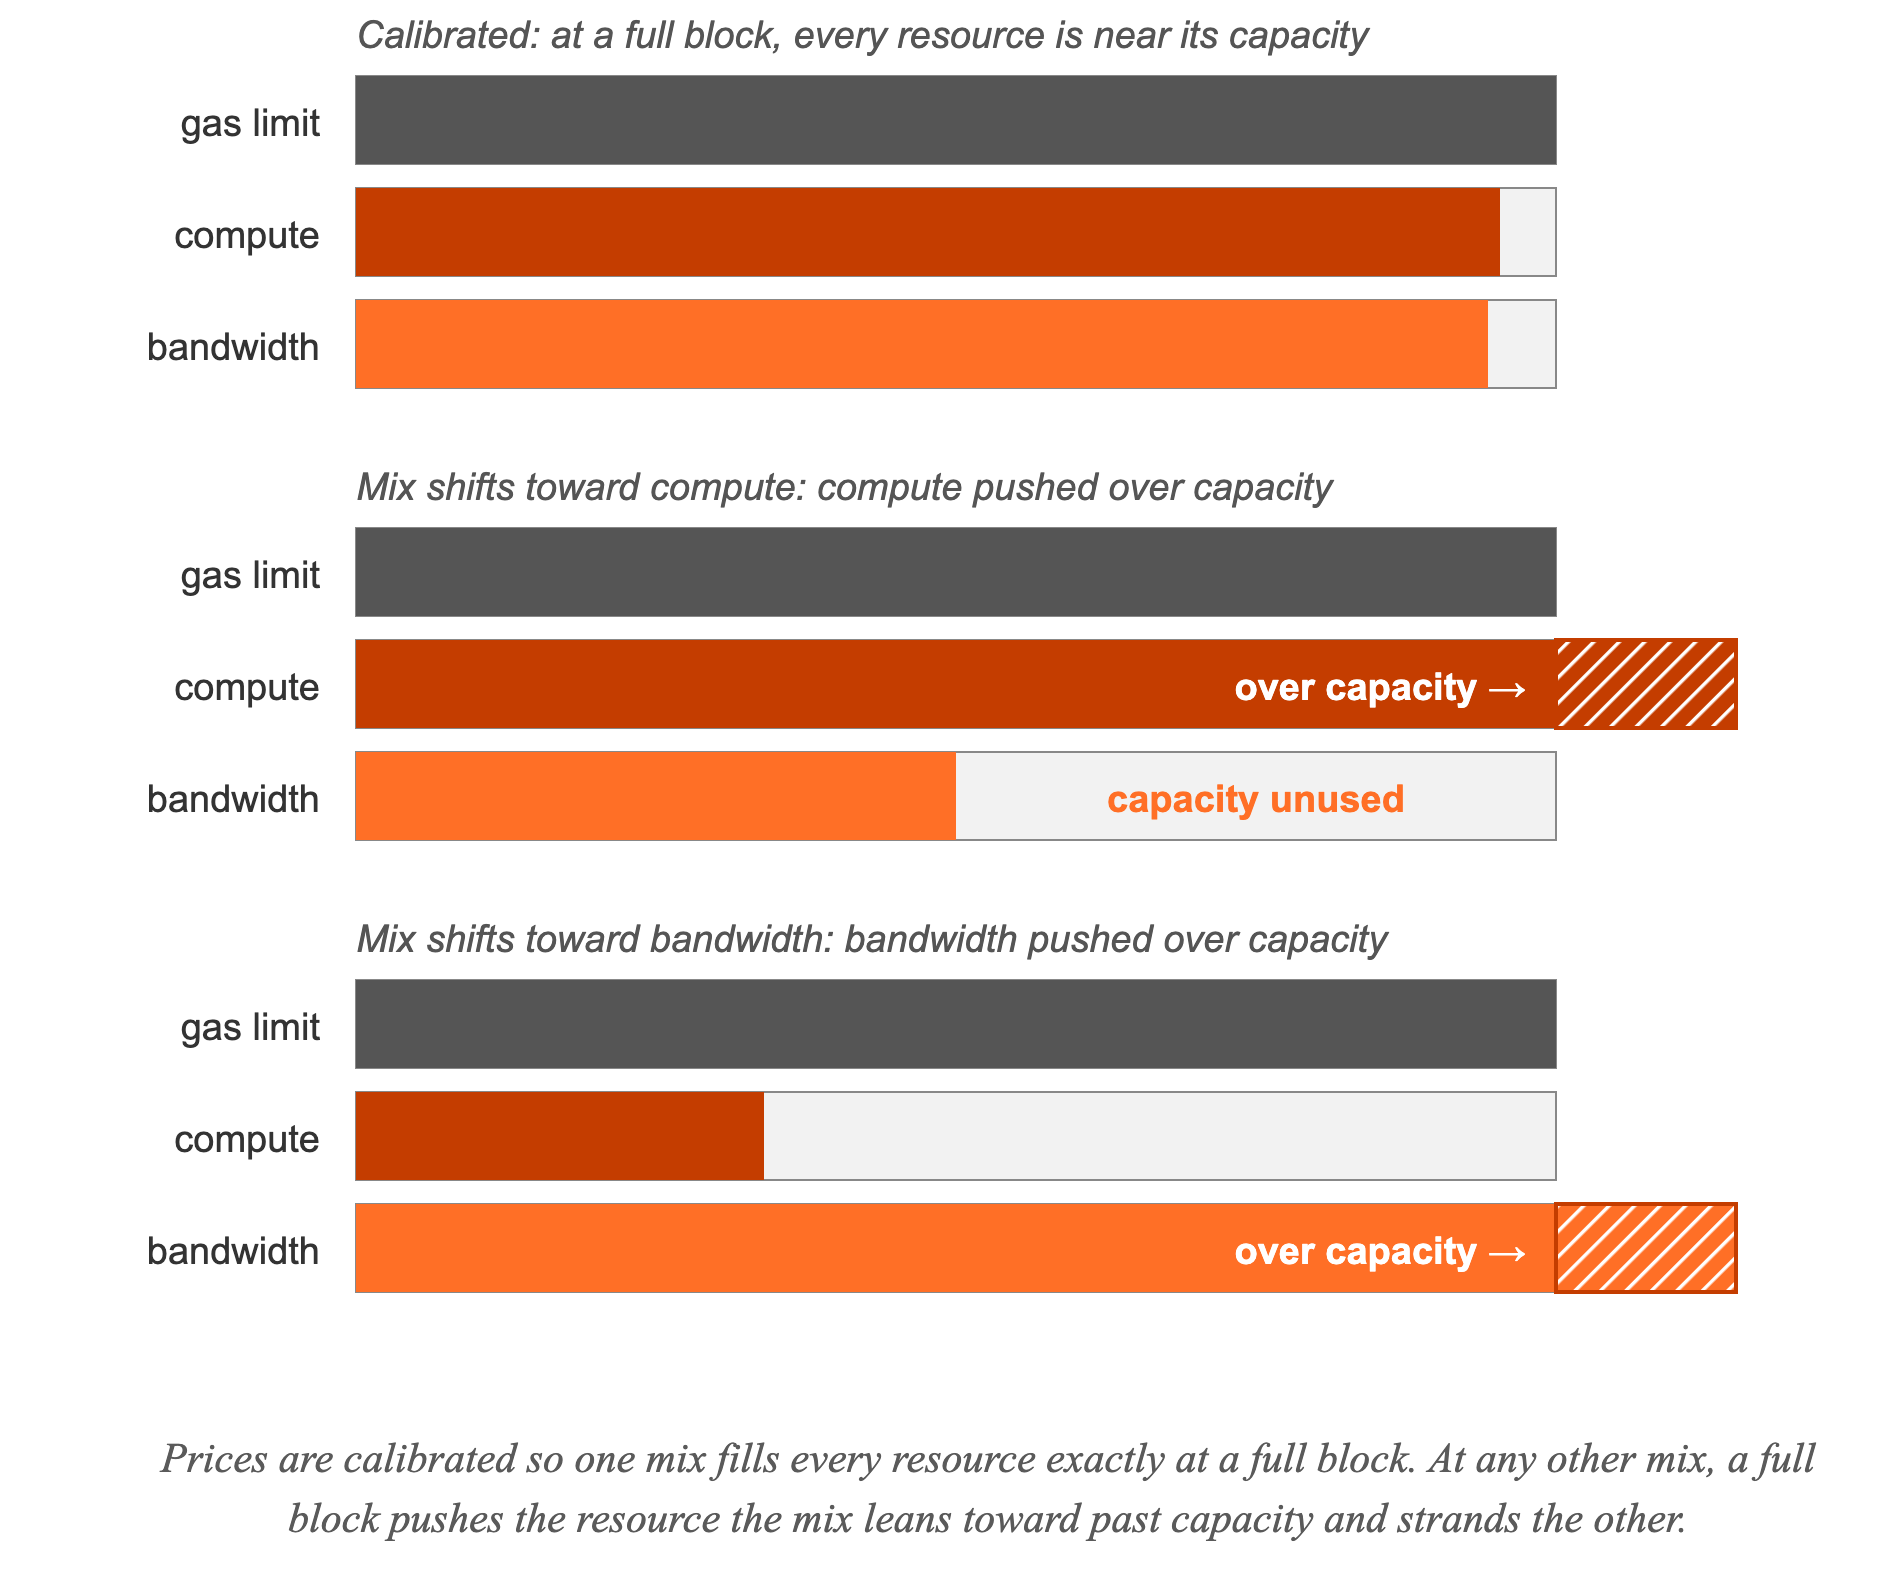
Despite enforcing the same price schedule, Ethereum and Base demonstrate significantly different compositions of operations that vary over time. Transaction execution consumes an inherently multi-dimensional vector of resources: compute, storage, function calls, calldata posting. Gas accounting projects that vector onto a singular number through fixed relative prices, and such prices can only track relative scarcity for a specific mix. When the proportions move, the prior price combination is no longer efficient.
However, these proportions differ by chain. On Ethereum, storage writes take 34.9% of execution gas, reads 22.7%, compute 20.2%. On Base, reads take 29.2%, compute 24.3%, writes 25.5%. Execution accounts for 93.3% of total gas on Base versus 79.8% on Ethereum, in part because simple transfers, which carry no execution gas, make up a third of Ethereum's transactions.
The call profile differs in a similar way. STATICCALL (read-only call) takes up 66.8% of call gas on Base and 22.4% on Ethereum. Contracts on Base, when interacting cross-contract, end up mostly inspecting other contracts' state.
Base transactions also touch more storage, and use more of it cold: 58.1 SLOADs per transaction on average against 21.0 on Ethereum, with 49.7% of them cold against 39.6%.
We trace a good proportion of the divergence back to the MEV differences across the chains (with optimistic or spam MEV being the dominant form of MEV on Base, where transactions perform a lot of reads relative to few "successful" writes): MEV takes up 41.2% of Base's gas (43.6% of its transactions) and 18.8% of Ethereum's gas.
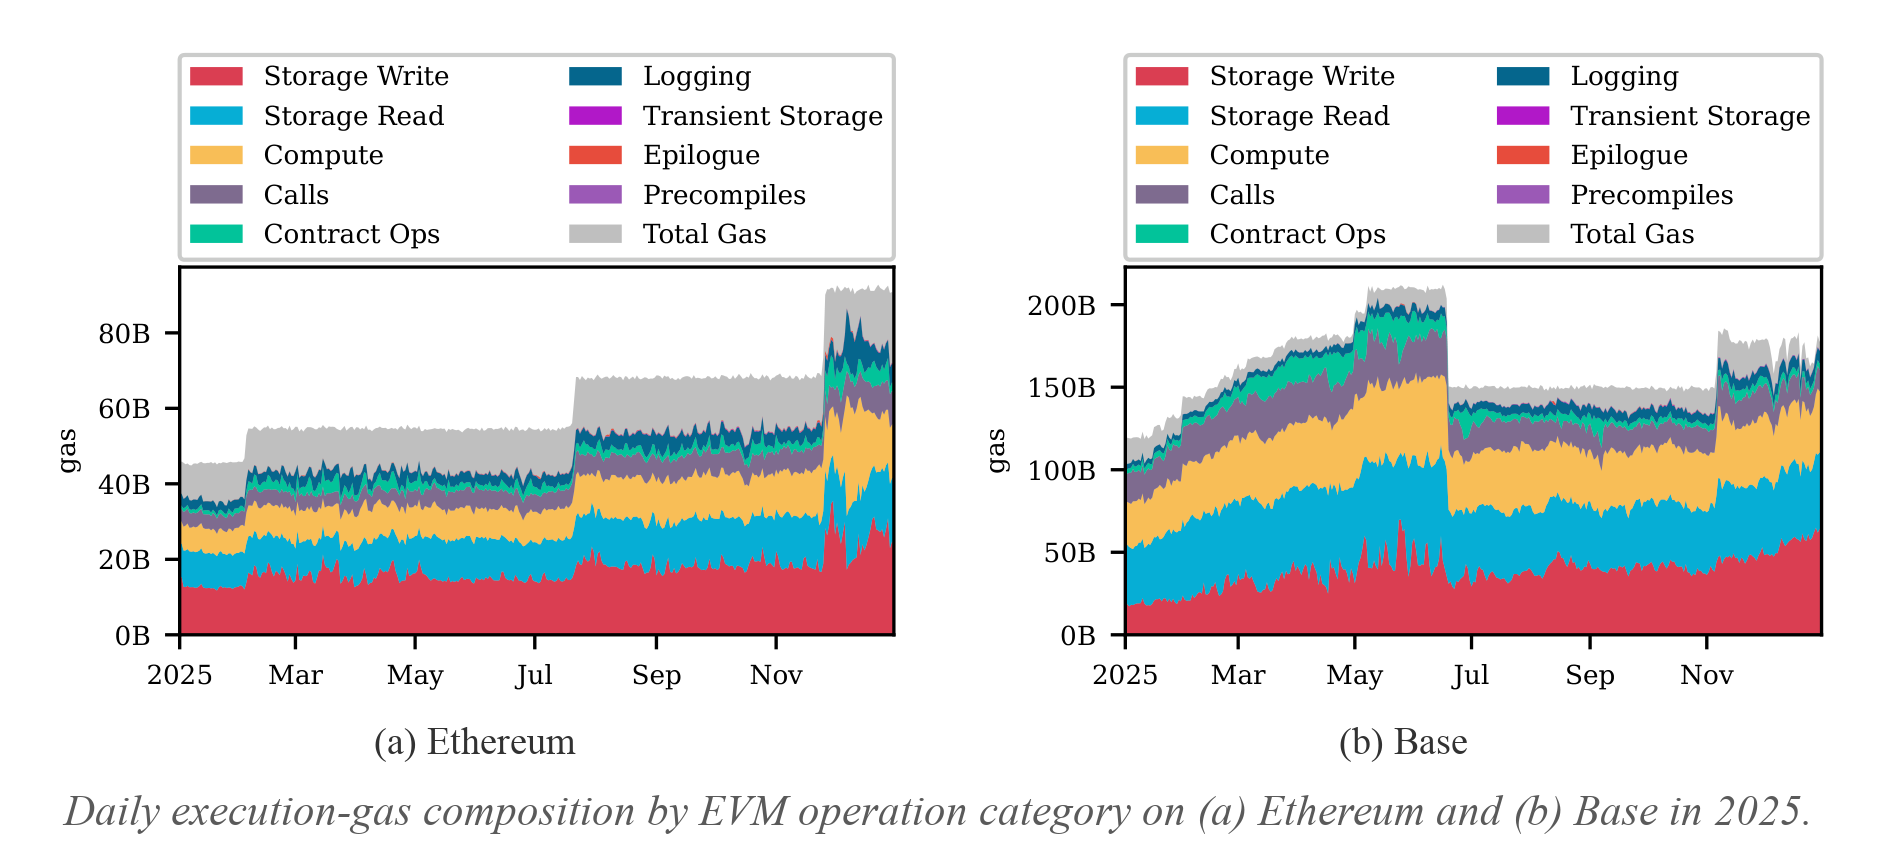
The mix also shifts within each chain during 2025. Ethereum changed the gas limit from 30M to 60M during 2025, and between January and December storage writes fell from 35.6% to 32.5% of execution gas while compute rose from 18.0% to 23.8%, shifting more towards Base's pre-existing profile. Falling writes with rising compute is also the shape of speculative activity. Speculative transactions read and compute a lot but land few writes.
The permanent cost of state growth
While both compute and bandwidth are transient resources, state created is persistent, mostly consisting of new accounts, storage slots, and bytecode blobs. Gas charges for a storage write once, at inclusion, even though the cost it creates is permanent.
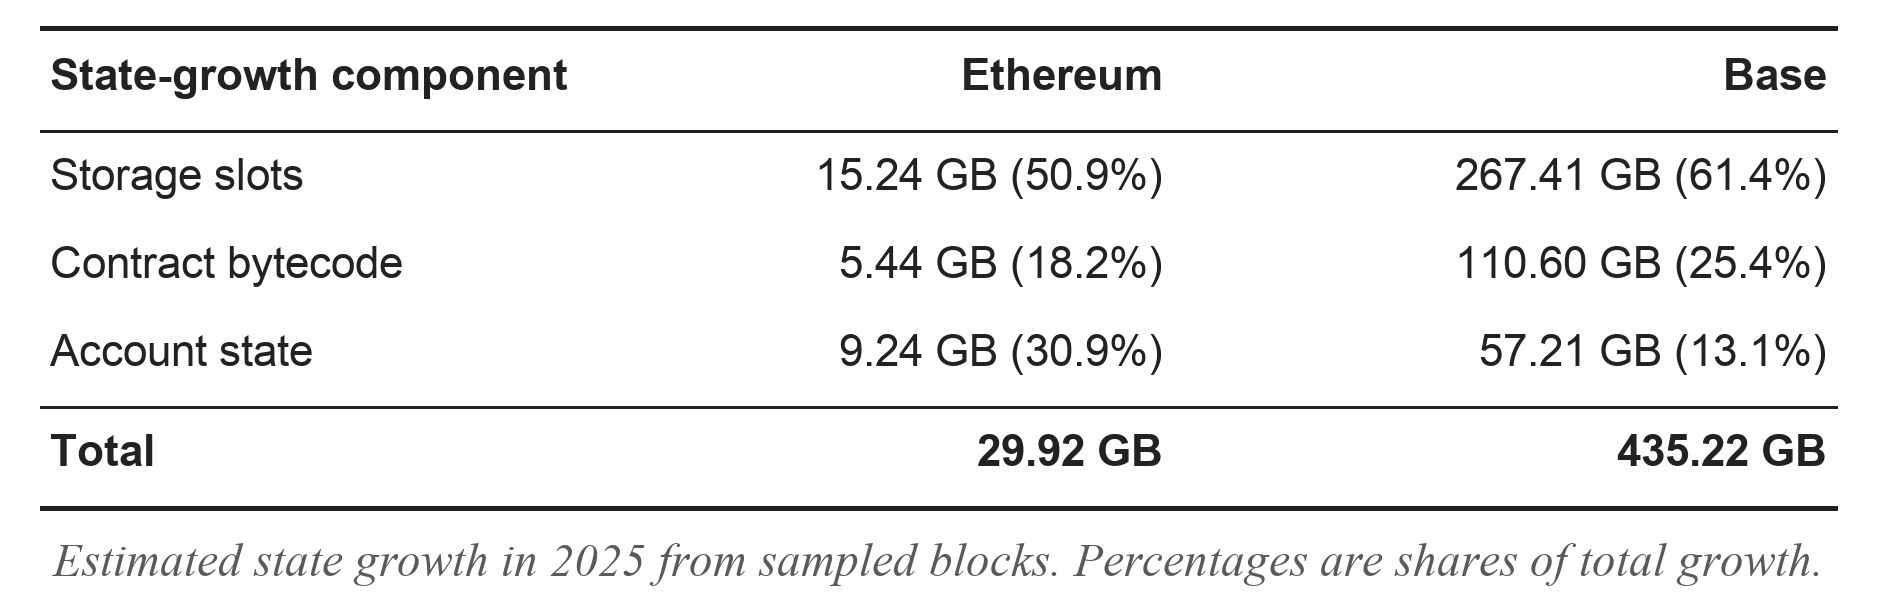
We show that, in 2025, Base added an estimated 435 GB of persistent state, whereas Ethereum added an estimated 30 GB. (In both figures, we count logical bytes, 64 per slot and 128 per account, extrapolated from our sample.) We can immediately see that the 14.5× multiplicative difference cannot be explained by the gas limit difference alone. As a result, workload composition is the diverging factor. Storage slots dominate growth on both chains, at 61.4% on Base and 50.9% on Ethereum; bytecode contributes 25.4% and 18.2%; while account creation contributes 13.1% and 30.9%.
The heavy weight of new accounts on state explains an interesting phenomenon on Ethereum: simple transfers make up 33.2% of Ethereum's transactions and 6.7% of its gas, yet account for a disproportionate 15.4% of its state growth. As a result, simple transfers produce roughly half of all account-state growth.
We also empirically establish that state growth is significantly bursty: daily state growth on Base ranges from 354 MB at the 1st percentile to 3.1 GB at the 99th. One contract alone produced 12.2% of Base's 2025 state growth while only being 0.03% of its transactions, about 53 GB of state for the year. The contract (0x9Ec1C3DcF667f2035FB4CD2eB42A1566fd54d2B7) is a deployer for the XEN token, known for generating heavy on-chain storage. Per-block gas limits are inherently ill-suited to control this kind of bursty, persistent accumulation: they cap usage inside a block and do not reason about the inter-block accumulation.
We leave this section with the observation that state turnover is also different across chains; perhaps as expected, 34.6% of newly-created slots are later deleted on Ethereum against 22.5% on Base.
Execution outcomes shift with the state
When a user submits a transaction, it is simulated on the state available at that time. That state is generally not the one the transaction finds at execution. Thus, the execution outcome can shift, which becomes more likely with larger state drift. Fast, high-throughput chains widen this gap; several blocks can pass between when a transaction is created and when it executes. Delayed execution, as deployed on Monad, builds the gap in.
To understand the impact on user experience and on access lists, which require state accesses to be predictable ahead of time, we measure the impact of state drift on transaction execution. For this, we measure the delta between transaction simulation at various lookbacks (transaction generation time is chain-specific) and its actual execution (approximated as block inclusion). Crucially, in many transaction patterns, the execution context (pre-state) affects both the end results and the gas used for that transaction. Example reasons for this variation include control flow branches and the actual storage slot contents (zero versus non-zero) encountered during execution. For this part, we focus our measurements on September 2025, and re-run every sampled transaction against earlier states.
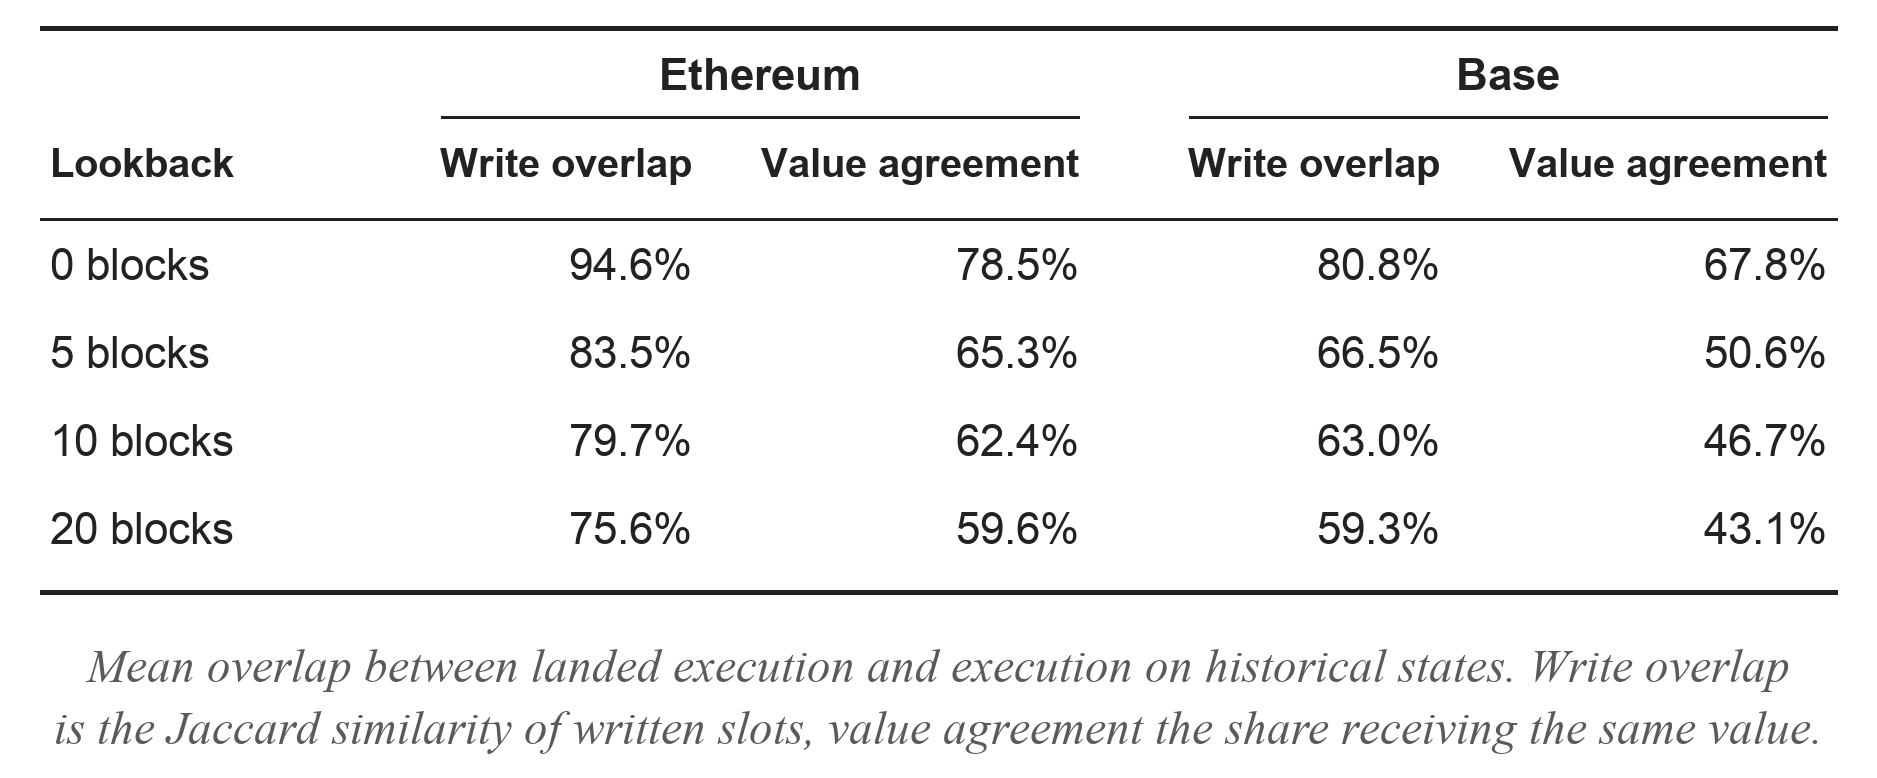
Before we continue, let's define a term we will be using: lookback N is the state at the end of block b−1−N for a transaction included in block b, so lookback 0 is the state one block before inclusion. We query eth_estimateGas at lookbacks 0 through 20 and replay full execution at lookbacks 0, 5, 10, and 20.
On Base, across the four lookbacks, 46.0% of transactions have a different gas estimate, while on Ethereum, this is only 13.9%. The mean coefficient of variation (CV) of the estimate is 6.88% on Base and 0.57% on Ethereum, and the median transaction on both chains shows zero variation. This variation exhibits a fat tail: at the 99th percentile, the estimate's standard deviation exceeds its mean on Base (CV 139.7%, against 14.8% on Ethereum).
The divergence cannot be explained by block time alone: 20 Base blocks span about 40 seconds, while 5 Ethereum blocks span about 60 seconds. We observe that the gap remains if we compare lookback 20 on Base with lookback 5 on Ethereum.
Looking further into the category breakdown is particularly revealing: Ethereum MEV transactions vary more often than Base's MEV transactions, with 61.2% exhibiting variation against 54.2%, but only by small amounts: mean CV 1.81% against 10.11%. DeFi transactions show the reverse ordering (53.0% of Base DeFi transactions vary against 44.0% on Ethereum), but transfers and contract creations sit near 0 on both chains.
Replaying the transactions, we uncover that, while the set of slots transactions read stays stable (with a median Jaccard overlap of 100% between the landed state and lookback 0 on both chains), the write sets diverge: the mean analogous write-set overlap drops to 94.6% on Ethereum and 80.8% on Base. Furthermore, among slots written in both runs, the written values agree for 78.5% and 67.8% of transactions, respectively. MEV transactions, as anticipated, are even more extreme in write-set overlap divergence: at lookback 0, Base MEV write-sets overlap 45.3% of the time, against 81.0% for Ethereum MEV transactions.
This is the pattern spam MEV produces. The transaction reads the state and then decides whether to act. If the opportunity is there, it trades and writes. If not, it exits early and writes almost nothing. Either way it reads more or less the same slots, so the reads stay largely stable while the writes do not. Spam MEV goes after opportunities created by transactions in the same block, and lookback 0 removes those exact transactions. Thus, the write overlap between the actual execution and lookback 0 is small.
Design directions
We now shift gears to examine some of the motivating questions and designs that affect the measurements conducted in our paper, focusing on delayed, parallel, and high-throughput designs.
First, in delayed execution primitives (such as those used by Monad and Avalanche's ACP-194) consensus is reached on transaction ordering before execution. As a result, a transaction's pre-state is generally unknown at inclusion time by design; both protocols currently charge on the declared gas limit due to the unknown actual gas used at that point. Our state sensitivity analyses are particularly helpful in this light, as they can be used to measure the expected overpayment or reverts for state-sensitive transactions. This is particularly useful for more intelligently setting the gas limit on a Monad transaction (see our prior blog post for guidance), by transaction type.
Second, our read-set overlap analysis can help inform parallel execution and populating access lists. Optimistic parallel execution, which Monad implements, runs transactions speculatively and retries the ones that conflict. Importantly, the retry is cheap as long as a transaction reads roughly the same slots regardless of pre-state (which is a function of the position in the block). If the read set stays the same, the relevant state is already in cache from the speculative run. Our overlap numbers describe how often that holds. Read sets stay largely stable on both chains, and any existing drift is concentrated in MEV and DeFi transactions. These differences should be accounted for in the scheduler's design. The same stability determines whether an access list declared at signing time closely reflects what the transaction touches at execution. Transaction types with large deviations in their access patterns should not use access lists.
Lastly, encrypted mempools, multiple concurrent proposers, and higher-throughput designs increase the inherent uncertainty between the times of transaction submission (simulation) and actual execution, hence widening the gap between the state a submitter (such as a wallet or bot) can use and the eventual state a transaction executes against. All these make lookback estimates particularly insightful in their respective contexts.
More broadly, multi-dimensional metering lets relative prices float instead of staying fixed. Thus, even as the workload mix might shift through time, a well-tuned multi-dimensional fee controller can dynamically ensure individual resource constraints are appropriately respected. Such a fee controller enables more permissive and flexible resource utilization as reflected by the real constraints and efficiencies of the underlying system.
Check out our paper for the full analysis, category breakdowns, and methodology.
